
Het jaar 2020 heeft ons tot op het bot geschokt. Tijdens de COVID-19-crisis werden alle vastgoedmarkten getroffen, maar één markt in het bijzonder wist goed te overleven; de woningmarkt.
Het jaar 2020 heeft ons tot op het bot geschokt. Tijdens de COVID-19-crisis werden alle vastgoedmarkten getroffen, maar één markt in het bijzonder wist goed te overleven; de woningmarkt. Volgens onze gegevens blijven de huizenprijzen stijgen, wat leidt tot enkele vragen. In deze serie analyseren we de woningmarkt; is er een sprake van een bubbel of is er nog ruimte om te groeien?
In onze vorige update schreven we over de signalen op de koopmarkt. Hierdoor vroegen we ons af of een oververhitte koopmarkt dezelfde lastige situatie op de huurmarkt zou kunnen veroorzaken. Wordt een grote groep van de Nederlandse bevolking gedwongen te huren? Zijn er gevolgen voor de huurmarkt nu de buy-to-let markt in opkomst is?
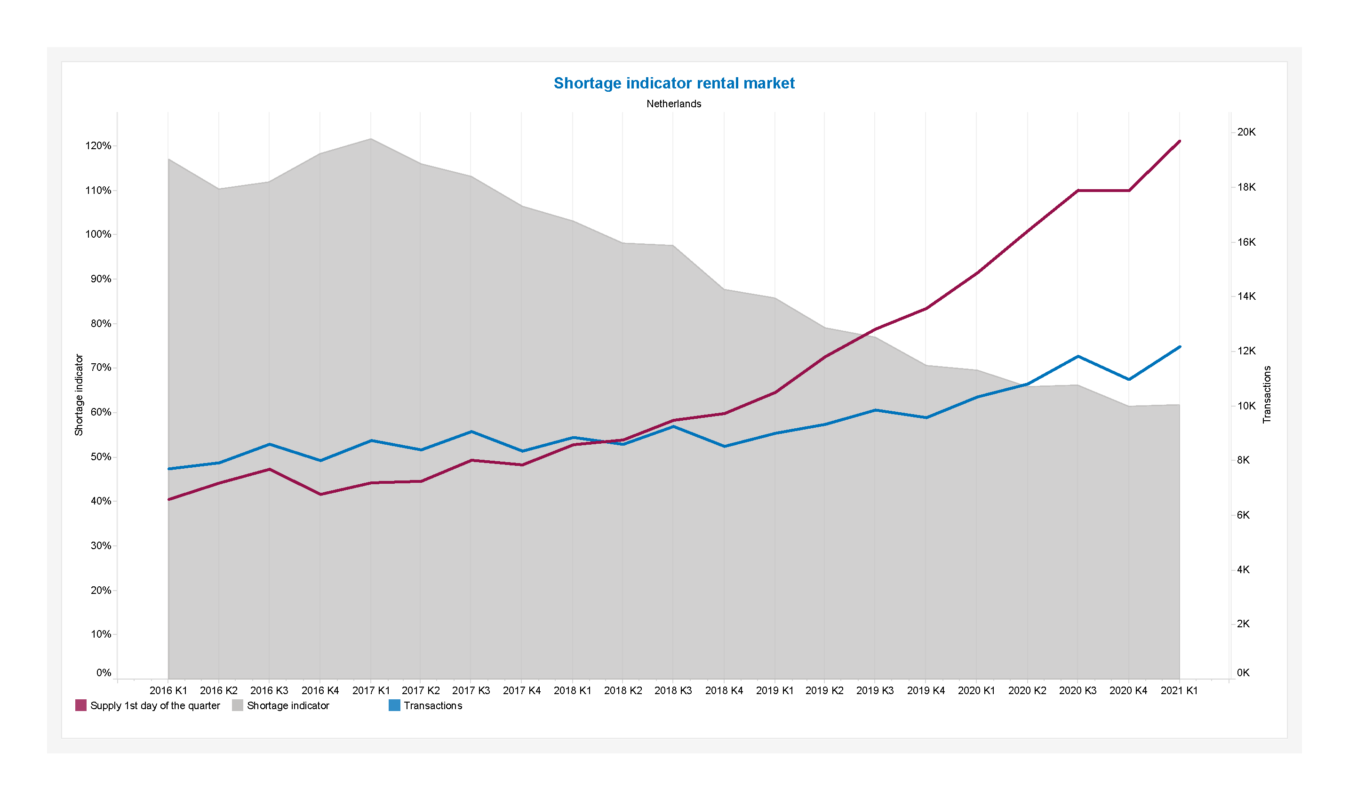
Als er krapte is op de koopmarkt, kunnen we ook krapte op de huurmarkt verwachten. Dit komt niet tot uiting in onderstaande krapte-indicator. Het aanbod op de huurmarkt stijgt sterker dan de werkelijke vraag.
De huurmarkten in de grote steden van Nederland kenmerken zich door een grotere huurvoorraad en een grotere vraag. Maar als we kijken naar het tekort binnen de vier grote steden zien we dezelfde trend. Namelijk; het aanbod groeit sinds het derde kwartaal van 2018. Vooral in Amsterdam groeit het aanbod merkbaar sterker ten opzichte van de vraag. In Utrecht zien we het tegenovergestelde. Hoewel we dezelfde trend zien, groeit het aanbod minder sterk. De krapte-indicator in Utrecht daalt, maar is relatief hoog (70%) in vergelijking met Den Haag, Amsterdam en Rotterdam.

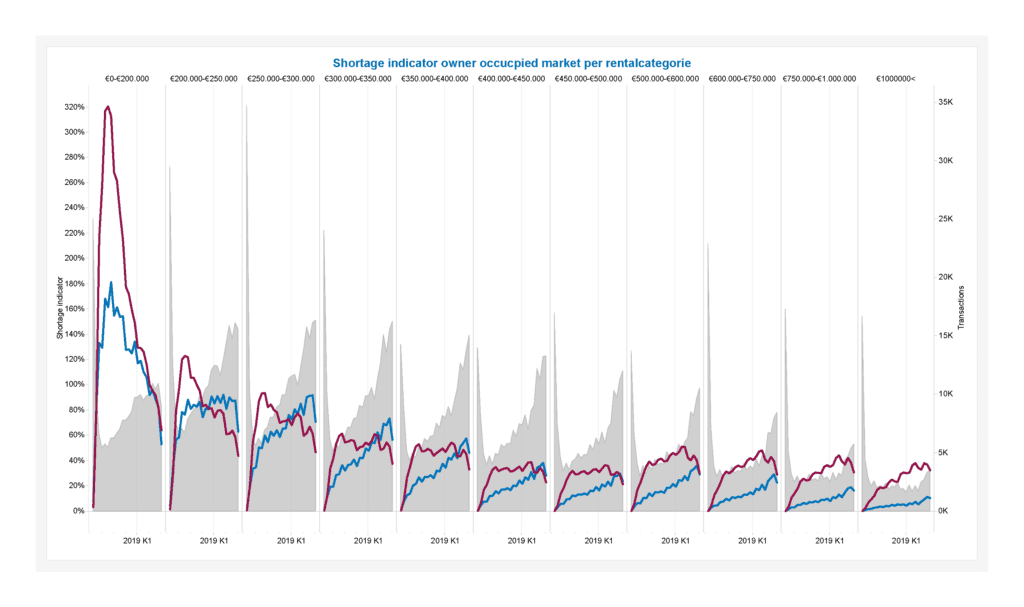
Nu we zojuist dezelfde trend hebben beschreven voor Nederland en de vier grote steden, zijn wij benieuwd of dit voor elke verhuurcategorie geldt. Vooral voor de huurcategorieën boven de € 1.000,-per maand is het aanbod de afgelopen jaren sterk gestegen. We merken op dat de krapte-indicator hoger is voor de relatief goedkopere huurwoningen (<€ 1.000 p.m.).
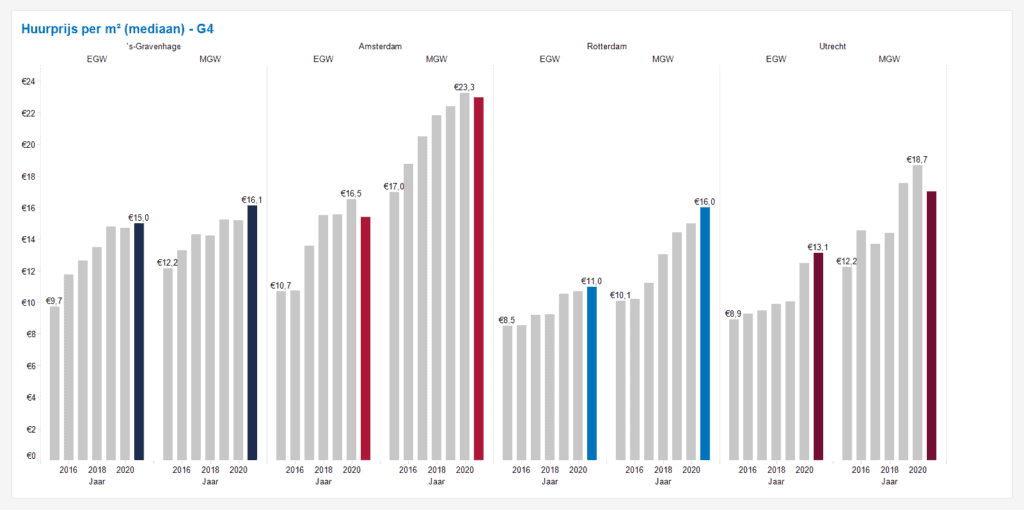
Ten slotte groeit de ongelijkheid tussen vraag en aanbod vooral in de duurdere huurcategorieën. Heeft dit effect op de huurprijs per vierkante meter? Voor bijna elke grote stad in Nederland merken we een stijging. Met uitzondering voor Amsterdam en Utrecht. Hier merken we een terugval in de vierkante meter huurprijs. Dit duidt op een limiet van de huurprijs in deze steden. Dit geeft ruimte in andere steden om te groeien. Daar zijn de huurprijzen nog betaalbaarder.
2020 has shocked us to the core. During the COVID-19 crisis all real estate assets were hit, but one asset in particular managed to survive very well; the housing market. According to our data, housing prices continue to rise which led to some questions. In this series we analyse the housing market and to which extend we note a housing market bubble or whether there is still room to grow.
We wrote about the overheated signals on the owner-occupied market in our previous update. This made us wonder whether an overheated owner occupied market could lead to the same troublesome situation on the rental market. Is a large group of the Dutch population forced to rent? Are there any consequences to the rental market now that the buy-to-let market is on the rise?
If we have shortage on the owner occupied market we can expect a shortage on the rental market as well. This is not reflected in the shortage indicator below. The supply on the rental market rises stronger than the actual demand.
The rental markets in the big cities of the Netherlands are characterized by a relatively higher rental housing stock and higher demand. But if we take a look at the shortage within the 4 big cities we note the same trend; The supply is increasing since the third quarter of 2018. Especially the supply in Amsterdam is growing noticeably stronger compared to the demand. In Utrecht we see the opposite. Even though we note the same trend, the supply is growing less intense. The shortage indicator drops but is relatively high (70%) compared to The Hague, Amsterdam and Rotterdam.
Since we just described the same trend for the Netherlands as a whole and the 4 big cities. We are curious whether this counts for every rental category. Over the recent years the supply rose strongly especially for the rental categories above €1.000 per month. Noting the shortage indicator being higher for the relatively cheaper rental houses (<€1.000 p.m.).
Lastly, the discrepancy between supply and demand is growing especially in the more expensive rental categories. Does this have any effect on the m² rental price? For almost every major city within the Netherlands we note an increase. With an exception for Amsterdam and Utrecht. Here we note a relaps in the m² price. Indicating a limit in the rental price in those cities. Which enables room to grow in the other big cities. Here the rental prices are still affordable.
Curious about the affordability of the rental market within the Netherlands? Keep an eye on our page for the next update.